Performance is a Feature: Avoid Losing Users and Conversions
Improving and protecting your website performance can directly affect your results. Understanding just how much that is will give you and your team a powerful tool and a new way to impact your users' experience.
 Your website if you don't take care
of its performance - photo by Pascal van de Vendel on
Unsplash
Like José M. Perez said beautifully in his article Fostering a Web Performance Culture:
Web Performance is not only about understanding what makes a site fast. It’s about creating awareness amongst both developers and non-developers. Performance is a feature and needs to be prioritized as such.
Mainly to get buy-in from non-developers we need to size how much improving performance impacts business metrics, and precisely to what degree each deterioration impacts the same metrics.
In QuintoAndar we recently implemented tools that are already allowing us to do this kind of analysis, and I'd like to share with you some of these findings focusing on two things that are usually very important for any business:
User Acquisition: Bounce Rate
According to Google:
Bounce rate is single-page sessions divided by all sessions, or the percentage of all sessions on your site in which users viewed only a single page and triggered only a single request to the Analytics server.
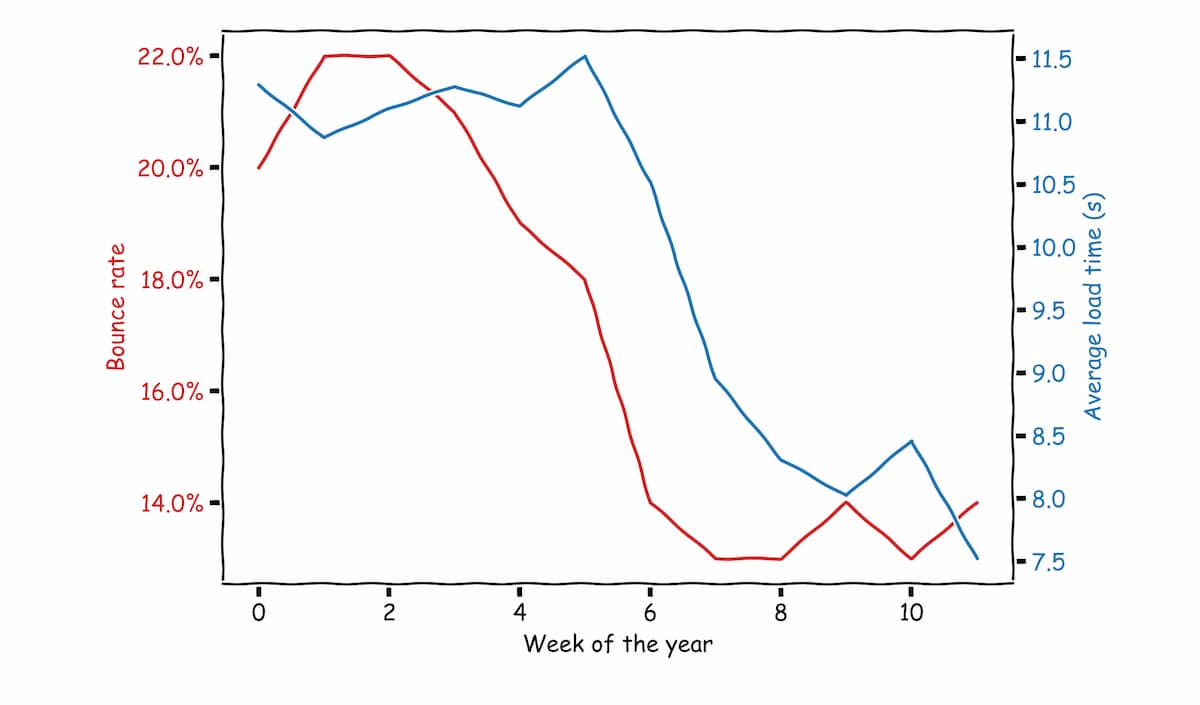
So if we have a high bounce rate, users are not staying on our website and leaving before performing any relevant action. It's intuitive that a slow website might lead to more users leaving the page, but it's hard to grasp just how many users we're losing for each second longer our page takes to load, hint, it's more than you may think it is (well at least for us, it was):
 In these 12 weeks, we lowered our average load time by 33.3% and
bounce rate by 32.65%
After seeing this trend, we started looking to Web Performance improvements not only as a way to drive more conversion but also as a tool for user acquisition. Improving our performance metrics leads to more users looking at the site for two main reasons:
- Better UX: Improving performance improves everyone's usage of our product;
- The website becomes accessible to them. Users with older devices and/or slow networks start being able to use our product.
More people using our product usually leads to more customers down the line. But we don't just add volume. In this next section, I'll try to show you that we're also making our funnel more efficient when we do performance optimizations.
Conversion: Give your users the UX they deserve
In QuintoAndar, we're passionate about UX and have been since I joined 3 years ago (go check out our QuintoAndar Design Blog). We do research, lab tests, and field tests both quantitative and qualitative, and strive to empower our users through the products we provide to them.
With that experience, we've come to understand that our product's performance is an integral part of that UX so it shouldn't be treated any differently and have started tracking more and more User-Centric Performance Metrics both in the field and in the lab.
We want to improve our users' experience, so we frame these metrics on terms that are relevant to our users:
| Question to answer | Description | |----------------------------- |------------------------------------------------------------------ | | Is it happening? | Did the navigation start successfully? Has the server responded? | | Is it useful? | Has enough content rendered that users can engage with it? | | Is it usable? | Can users interact with the page, or is it busy? | | Is it delightful? | Are the interactions smooth and natural, free of lag and jank? | Performance metrics Questions table - taken from web.dev's User-Centric Performance Metrics
There are many different metrics we use for each of these steps, but we'll focus on how two important ones have affected our conversion metrics:
- First Contentful Paint (FCP): Measures the time from when the page starts loading to when any part of the page's content is rendered on the screen. In our case, this metric is, as of now, very close to the value of another metric that we heavily recommended tracking: Largest Contentful Paint (LCP);
- First Input Delay (FID): measures the time from when a user first interacts with your site (i.e. when they click a link, tap a button, or use a custom, JavaScript-powered control) to the time when the browser is able to respond to that interaction
Paint
The main questions involved in paint metrics are:
- Is it happening?: Receiving a paint is what gives the user the idea that the page is loading and somebody responded to the request the user made. If we don't respond quickly, a lot of our users will feel like there's a problem and leave altogether;
- Is it useful?: A lot of pages are mostly about content, and the content of a page is what makes it useful;
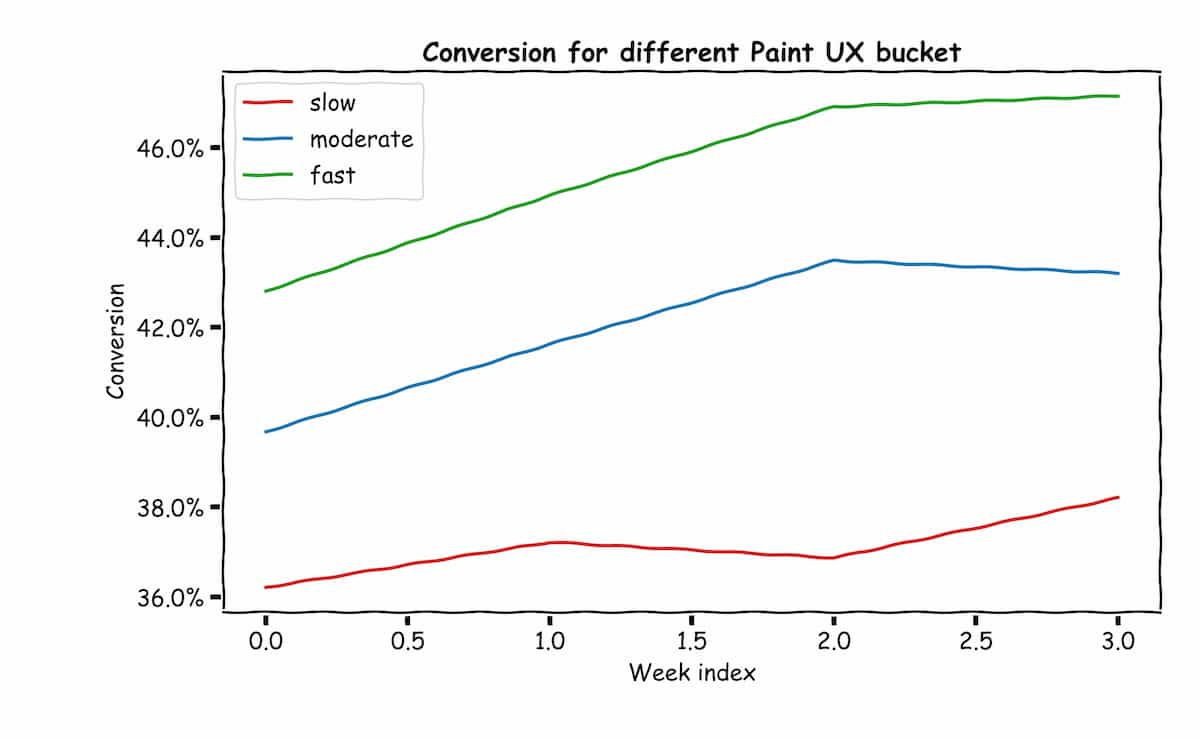
Based on benchmark values from page speed insights, we classified our Users' experience in what we called UX buckets. The results we had classifying user paint experience for one of our most important conversion metrics were impressive:
 Paint speed and experience will directly affect
your conversion
Some insights from that data:
- For mobile users, moving from slow to a moderate UX bucket would mean increasing his chance to convert by 12%;
- For mobile users, moving from slow to a fast UX bucket would mean increasing his chance to convert by 22.2%;
- Bad First Contentful Paints affect mobile users way harder than desktop users;
- Paints directly affect bounce rate and are one of the most correlated metrics with it;
- Long load times tax the user experience beyond a single Session. In other words, even if in the future we improve the load time, the user may still carry the impression that the website is slow and be less likely to convert.
Interactivity
The main questions involved in interactivity metrics are:
- Is it usable?: Content visible that invites interaction but cannot respond to it can be frustrating for your users
- Is it delightful: Responding to interaction may still not be enough if such a response comes with the appearance of a sluggish and janked experience.
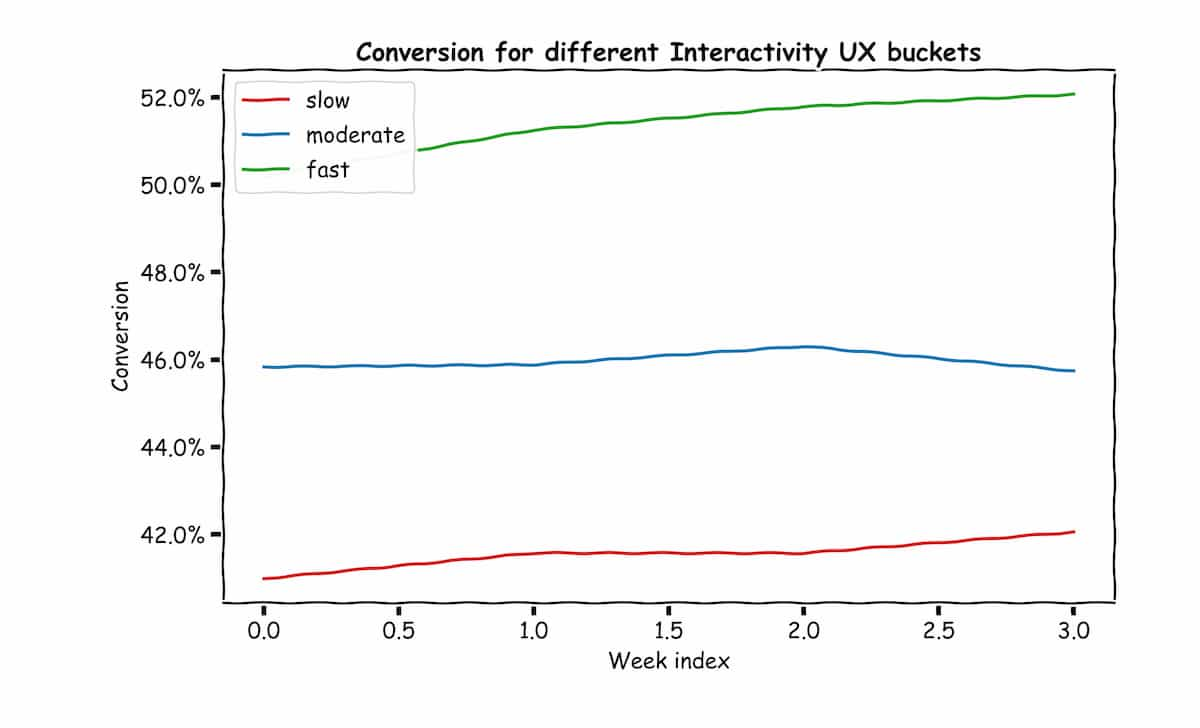
We did the same process we did for paint for interactivity metrics and also found impressive results
 Interactivity will directly affect
your conversion
Some insights from that data:
- For all users, moving from slow to a moderate UX bucket would mean increasing his chance to convert by 11.2%;
- For all users, moving from slow to a fast UX bucket would mean increasing his chance to convert by 22%;
- Interactivity affects heavily both mobile and desktop users;
- Long wait times for interactivity will tax the user experience beyond a single Session.
Conclusion
- Performance is a feature: Protect it and improve it like so;
- Understanding user behavior helps you quantify and validate performance improvements in terms of business results;
- Performance can greatly impact your conversion and acquisition metrics;
- Bad performance taxes the user experience beyond a single Session. In other words, even if in the future we improve the load time, the user may still carry the impression that the website is slow and be less likely to convert.
- Performance has multiple ways that it can be tracked and improved each composing a relevant part of the users' experience
See Also
- Metrics -- web.dev
- Fostering a Web Performance Culture -- José M. Perez
- Load Performance -- Web Fundamentals
Would you like to know more about how we track these metrics in production? Lemme know and I can follow up with a series of posts on the topic! :)